
Journal Safari: Whole Genomes, Read as Exomes
Published on • 6 min read
In July I read the UK Biobank consortium’s whole-genome paper. Its own head-to-head said that for protein-coding genes, whole-genome sequencing (WGS) mostly ties whole-exome sequencing (WES). Run the same rare-variant scan on the same ~460,000 people with each technology, and only 7.7% of the hits came from WGS alone. The case for genomes, I concluded, lives outside the coding genome.
Zhao et al. in Nature Genetics (open access) takes the opposite bet. Its first sentence: “In addition to its coverage of the noncoding genome, whole-genome sequencing (WGS) may better capture the coding genome than exome sequencing.” Forget the non-coding genome. Maybe WGS is just a better exome.
This is a big, careful effort aimed at a narrow question, so this installment is short.
What They Did
The Cambridge group behind it had already published UK Biobank exome analyses of body mass index (BMI) and type 2 diabetes (T2D), and the Methods say so plainly: “We adopted the same strategies used in our previous analyses using WES data.” Discovery used up to 489,941 UK Biobank genomes and replication used 219,015 from All of Us, 708,956 in all.
The method is a gene-burden test. Most rare variants are carried by a handful of people, too few to test one at a time, so you pool them. For each gene, pick a rule for which variants count (a “mask”), then ask each person one question: do you carry at least one qualifying variant? That turns each gene-and-mask pair into a single yes/no column you can test like a single variant. They used three masks: high-confidence protein-truncating variants (PTVs), plus damaging missense variants at two REVEL score cutoffs, all rare (minor allele frequency under 0.1%). Counting only masks with at least 30 carriers gave 81,350 tests, so the bar was P < 6.15 × 10⁻⁷.
The code availability statement settles the methods question in five words: “No custom code was developed.” So the novelty, if any, has to be in the results.
What They Found
Twenty-one genes pass: 10 for BMI and 12 for T2D, with UBR3 in both. Most were already known from exome studies, like GCK and HNF1A for diabetes and MC4R for BMI. Ten gene–trait associations are new, and five of those replicate in All of Us, in four genes: RIF1 and UBR3 for BMI, and UBR3, IRS2 and HNF4A for T2D.
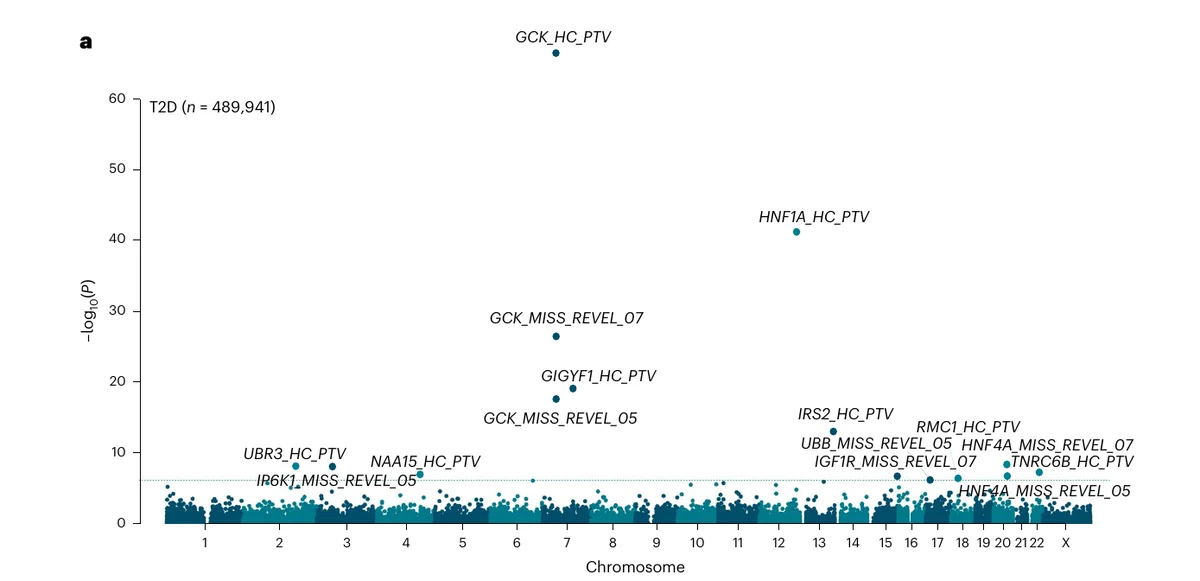
My first margin note was “only five? Surely there were more.” The paper answers that in one sentence: every new association “exhibited similar effects in published results using WES data from UKBB but at subthreshold significance (P ≤ 8.3 × 10⁻⁵).” The signal was already in the exomes. WGS didn’t uncover hidden genes. It pushed sub-threshold signals over the line. Even “new” is generous: a referee noted that RIF1 for BMI already showed up in Genebass, the public browser of UK Biobank exome gene tests, and HNF4A is a known cause of monogenic diabetes.
So what did the genomes add? For the associated genes, signal (mean χ²) rose 29% over the group’s published exome results, and the revision traced where it came from. About 4.6% came from analyzing all ancestries instead of Europeans only. About 21% came from WGS finding more qualifying variants in the same people, a median of 11.5 more per mask. Effect sizes were comparable to the exome results, so genomes mostly buy more carriers.
The analysis I liked most is a falsification test. Rerun the burden test using only the carriers that WGS found and WES missed. If those extra calls were noise, those people would look like everyone else. Instead, 16 of 23 masks (those with at least five such carriers) were nominally significant at P < 0.05. Flip it, using carriers only WES called, and not one mask reached even nominal significance. Using the phenotype to referee two call sets is a neat trick, and I’d like to see it used more.
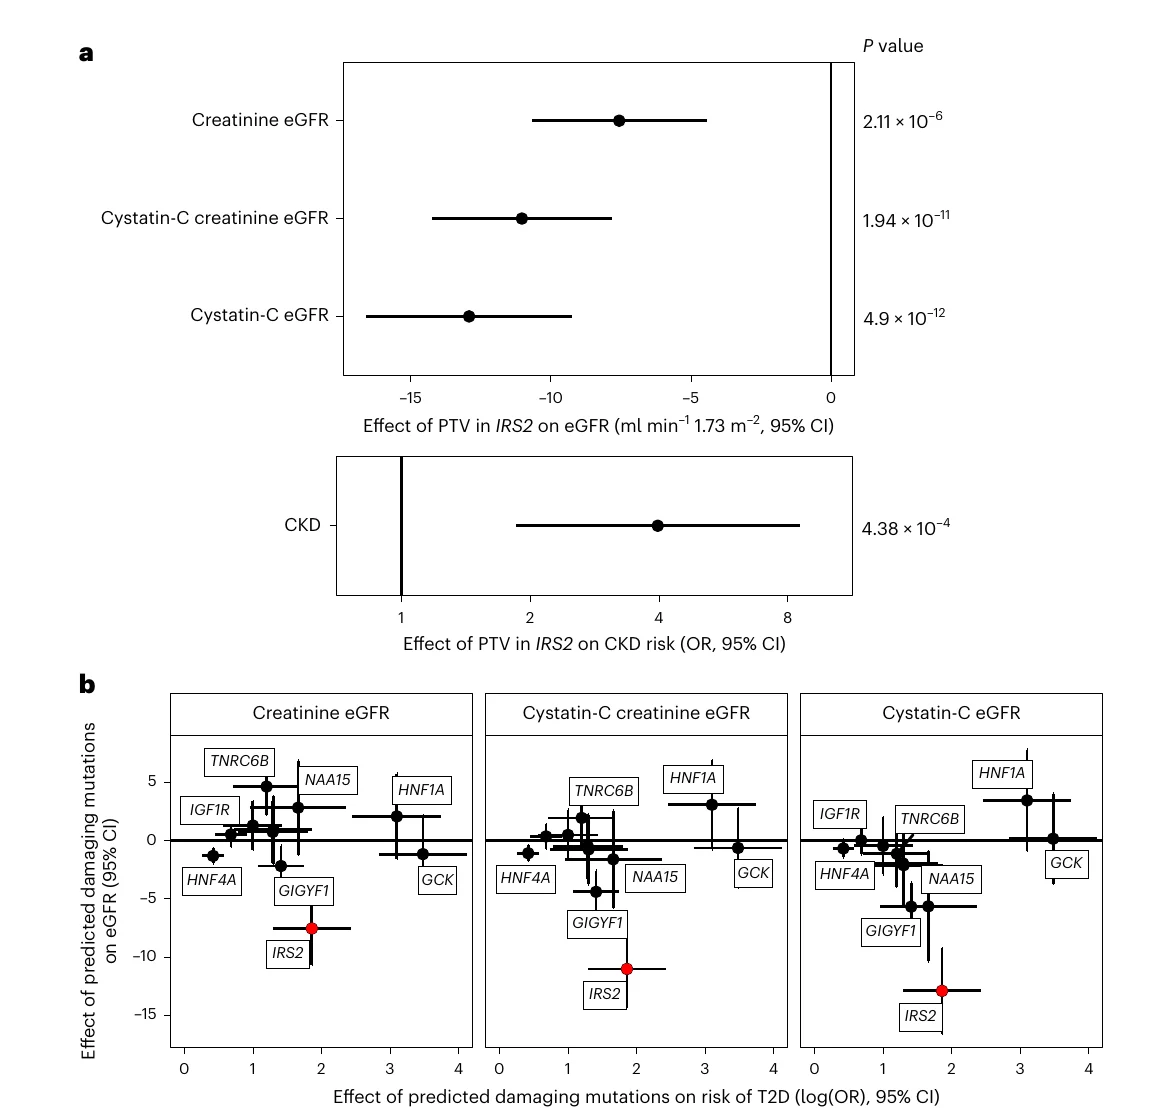
The standout gene is IRS2, an adapter protein just downstream of the insulin receptor. Carriers of an IRS2 PTV have 6.4-fold odds of T2D in UK Biobank (3.7 in All of Us), and 34% of UK Biobank carriers have it. A scan across other traits turned up something they weren’t looking for: kidney function about 13 points lower (cystatin-C eGFR, 55 carriers), and still about 10 points lower in the 36 carriers without diabetes. The paper’s argument that this isn’t just diabetes damaging the kidney is panel b below. HNF1A, a diabetes gene where small-vessel complications are known to follow poor glucose control, has a much bigger effect on diabetes than IRS2 and no drop in kidney function.
What I’d Push On
“WGS” in the title, an exome in the analysis. Coding variants only, two traits, burden tests only. No non-coding variants and no structural or copy-number variants, which are the usual reasons to pay for a genome. The peer-review file is public, and the referees had the same suspicion. Referees 1 and 2, writing jointly: “Though ‘selling’ the work as illustrating the value of whole genome sequencing, the paper barely scratches the surface of that topic.” The submitted title promised “novel insights into cardiometabolic health.” Referee 4 asked, “Is this cardio-metabolic or just metabolic? There is nothing about CAD or CVD,” and the published title dropped the “cardio” and added “gene-based analysis.”
The kidney claim rests on very few people. The chronic kidney disease (CKD) result is 58 carriers with 14% case prevalence, which works out to about eight people with CKD. Referee 4 asked for a replication in All of Us, which has the CKD data. What the paper has instead is a lookup in a public All of Us PheWAS, with “nominally significant, highly ranked” kidney traits. And in the response letter the authors quoted a new caveat, that any misclassification of diabetes cases as controls “would bias us towards this conclusion.” I can’t find it in the published paper, whose Discussion calls the result a “demonstration of a causal role for IRS2 in kidney health.”
Replication can’t separate biology from pipeline. UK Biobank was analyzed by one team with BOLT-LMM, All of Us by another with STAAR, using the same mask rules. When known-true signals like the GCK missense mask failed to replicate, the authors suggested it may reflect “the fidelity of missense classification tools” across cohorts, and told the referees that valid UK Biobank variants may simply have been missing from the All of Us masks. The paper doesn’t show the two variant lists, so a reader can’t tell which.
Is a better exome worth a genome? For about 21% more signal, measured on genes WGS had already picked out, I wouldn’t buy genomes for coding variants alone. I’m not sure that’s how the decision really gets made, though. If a genome costs close to what an exome does, the scarce thing is the samples, not the sequencing. Then you sequence everything you can, because you don’t know what tools will get pointed at the data in five years.
The Data-Infrastructure Coda
The authors said it themselves, answering the referee who raised Genebass: “We already have millions of genetic associations which we do not understand in any meaningful way.” Finding these associations was the quick part. Explaining IRS2 took the rest of the paper.
The object that actually gets tested is small: one yes/no column per gene per mask, a few gigabytes for half a million people by my arithmetic. The expensive part is building it twice, in two cohorts, by two teams. The authors called that setup a strength, and said running their own BOLT-LMM pipeline in All of Us wasn’t feasible because setting it up “is laborious and time-consuming.” When a mask fails to replicate, the first thing I’d want is the two variant lists side by side, and two teams on two pipelines is exactly what makes that hard.
I do data infrastructure for a living, and TileDB-VCF is part of my day job, so treat this as an interested party’s reading. It covers the storage half: population variants as sparse arrays you slice by genomic region and sample, with new samples added incrementally. It doesn’t touch the governance half. Each biobank still sets its own rules for where its data gets analyzed.
I want to start giving every paper I read a star rating, so the preprint-ranking intern I’m building eventually learns what I actually like. This one gets three out of five: careful, improved by review, and short on surprises.
See you in two weeks with the next one.
Related Posts
Journal Safari: What Do You Buy by Sequencing Half a Million Whole Genomes?
Journal Safari #2. The UK Biobank just finished whole-genome sequencing all 490,640 participants. I read the resource paper to answer one question: what does WGS actually buy you over the array and exomes we already had — and who pays the storage bill afterward?
Journal Safari: AlphaGenome Knows Which Way, Not How Much
Journal Safari #7. DeepMind's AlphaGenome reads a megabase of DNA, predicts thousands of genomic tracks, and matches or beats the strongest competing model on 25 of 26 variant tests, mostly by a little. It calls the direction of a variant's effect far better than the size, which makes it a scanner rather than a verdict, and a decent preview of where AI in biology is right now.
Journal Safari: Malva, An Index Is a Subscription
Journal Safari #5. Malva makes 74 million single cells searchable by raw sequence, answering 24-mer queries in milliseconds, and it found oral bacteria outside a tumour section that a reference-based pipeline discards by construction. The engineering is excellent. What decides whether it still exists in 2036 isn't in the paper, and three of its four referees spent ten months saying so.